

What History Reveals When the S&P 500 Sends Its Rarest Warning Signal
The Shiller CAPE Ratio just reached its highest level since the dot-com boom. But long-term investors don't have to worry.
Overview
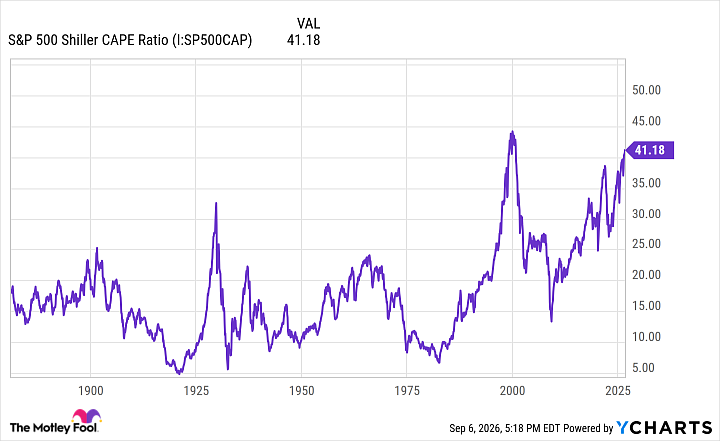
Many investors are worried that the U.S. stock market is getting too expensive. A widely watched metric for the S&P 500 index (SNPINDEX: ^GSPC) valuation is the Shiller CAPE Ratio. By calculating cyclically adjusted price-to-earnings ("CAPE"), this metric is meant to be a more consistent way to compare how expensive or undervalued the S&P 500 might be over time, across all kinds of economic conditions.
As of Sept. 6, the CAPE Ratio is 41.18. That's its highest level since 1999-2000, right before the dot-com crash. The CAPE ratio doesn't exceed 30 very often. But when it does, a stock market crash often follows. The first time the CAPE Ratio exceeded 30 was in 1929, right before the Great Depression.
Details
Source
Originally published at www.fool.com.