

The Stock Market Is Repeating a Pattern Not Seen Since 2000. Here's What History Says Comes Next.
Last time, investors got burned.
Overview
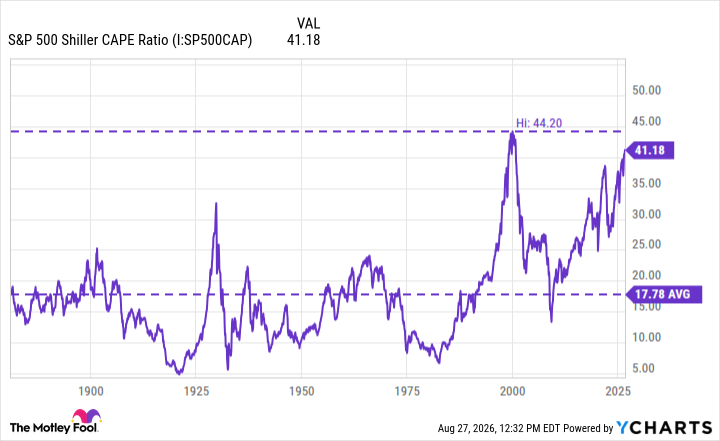
If you look closely at the last 150 years of stock market history, you'll see a clear pattern: Periods of extremely high valuations are often followed by disappointing returns, some of which lead to outright crashes.
Right now, we're living through one of the most expensive markets in history -- the second most expensive, as measured by the Shiller cyclically adjusted price-to-earnings (P/E) ratio. Since the 1880s, the Shiller CAPE ratio has averaged about 18. At the time of writing, it had exceeded 41. Only once has the market been this expensive, and that was during the dot-com era.
Details
Source
Originally published at www.fool.com.
Related Articles
Disclaimer: This article is for informational purposes only and does not constitute investment advice. Data may be delayed up to 15 minutes. Past performance is not indicative of future results. Consult a licensed financial advisor before making investment decisions.